LATEST RELEASE: BetaMatch version 3.4.0 - Get it here!

A marker is set to a frequency and can be turned OFF or ON. A frequency band consists of two markers and it is turned ON if both markers are turned ON. Frequency bands are used by the optimizer to determine which frequencies to optimize for.
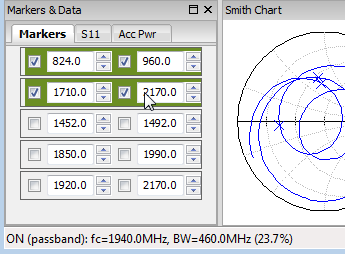
Individual markers can be set in the Markers & Data Window. To show a marker the box on the left side must be ticked and the marker frequency must be within the displayed frequency interval.
The marker frequencies will be automatically be saved and restored next time BetaMatch is started. This feature can be turned off by unticking Remember marker frequencies in the General Settings tab in BetaMatch Options (Tools Menu -> Options....
Marker frequencies are always given in MHz.
The marker frequency can be set by either:
Directly entering a value (in MHz) in the entry-box.
Clicking on the up- and down- arrows on the right side of the displayed frequency.
When the cursor is positioned in the text-entry window it is also possible to use the scroll-wheel to change the frequency up and down. The frequency will change with different steps depending on if the wheel (or arrow keys) are used alone or with any of the Shift, Ctrl or Alt keys:
- 1MHz when no key is held down
- 2MHz if the Shift key is held down
- 10MHz if the Ctrl key is held down
- 100MHz if the Alt key is held down
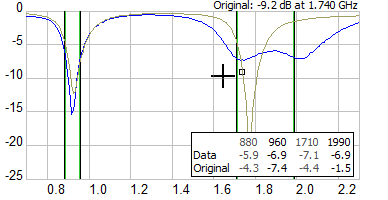
Marker values can be displayed in a table in each plot as in the |S11| plot below (see also tables in the plots shown in Screen Graphics and User Interface ). The tables can be turned ON and OFF and repositioned via the context menu for each plot.
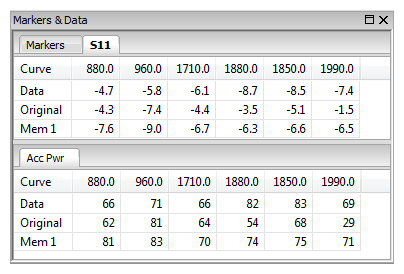
The |S11| and Accepted Power values for the marker frequencies can also be viewed by selecting the S11 or the Acc Pwr tabs. Values for the active curve, and any memory curves that are shown, will be displayed in a table.
The tabs can be dragged and freely rearranged within the window to show both tables at the same time (see example below).
A frequency band is defined by a lower and an upper frequency set by two markers. The currently defined bands are used by the optimizer to decide which frequency bands to optimize for.
Bands can either be set by setting the frequencies directly in the individual markers or by selecting preset frequency bands from the context menu or by selecting combination of bands from the Markers Menu.
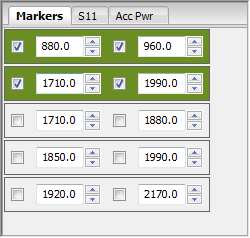
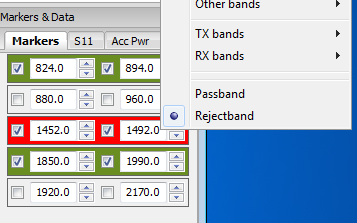
In the Markers & Data Window each marker must be set individually. The unit is MHz.
Markers must be set in pairs to define a band: left marker for the lower band edge and right marker for the upper band edge. If a band is valid it will be marked in either green or red colour depending on if it is a pass- or reject band.
Right-clicking on a band will bring up the Context Menu where the selected band can be set to any of several predefined bands. The bands are divided into GSM, WCDMA, LTE, Wimax and many other bands. Transmit- (TX) and receive (RX) bands can also be selected for GSM, WCDMA and LTE bands. A full list of predefined bands can be found in Appendix: Predefined frequency bands.

Marker context menu
In the Markers Menu the most common bands and combination of bands can be selected directly. This may overwrite the value of one or more frequency bands (marker pairs). Via the Frequency Band -> Marker Band X options any of the individual bands can be set to any frequency band (the frequency bands are the same as the Marker’s context menu).
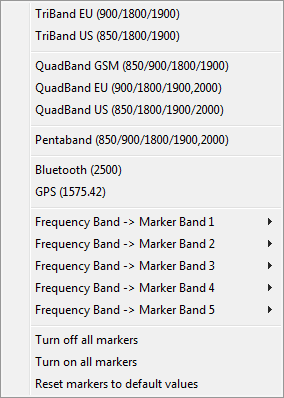
Markers menu
When the mouse hovers over any of the frequency bands information about that band will be displayed in the status-bar at the bottom. The information is if the band is ON or OFF, if it is pass- or reject band, center frequency and bandwidth in MHz and %. See figure below:
A band can be set as either Passband or Rejectband. The optimizer will maximize the power into the load for frequencies within a Passband and minimize the power for a Rejectband. To set this right-click on a markerband and select Passband or Rejectband from the popup-menu.
Pass- and reject- bands (green and red respectively).

Bands used for optimization in the statusbar. Reject band are shown within square brackets.
If the defined frequency bands overlap they will be merged by the optimizer. The final bands that will be used by the optimizer are shown at the right hand side of the status bar and also at the top of the Optimize Menu. Reject bands are shown within square brackets (Example: Bands: 880-960, 1710 - 1880, [2450-2500] MHz means that optimization will be for GSM900 and GSM1800 as passbands and 2.5GHz-band as an rejectband).
The bands are also indicated in the plots by green and red hints:
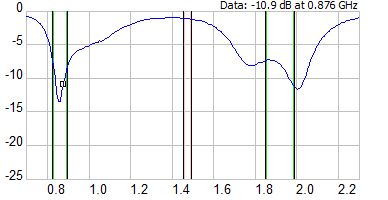
Passbands have a green lining and rejectbands have a red.
Note
Overlapping bands
It is a good idea to avoid overlapping pass- and rejectbands. This is because at the boundary between pass- and rejectbands the optimum accepted power is 50% and this is not normally desired. Therefore it is better to leave a gap between the different type of bands. Also: When the bands are overlapping there may be some confusion if the overlap is of pass- or reject type.
The valuemarker is a marker showing constant value in the LogMag, Accepted Power, VSWR and Smith plots. It can be toggled between on and off from the Show Valuemarker in the context menu for any of the above plots. The valuemarker is displayed as a black horizontal line in all plots except for the Smith Chart where it is a constant circle.
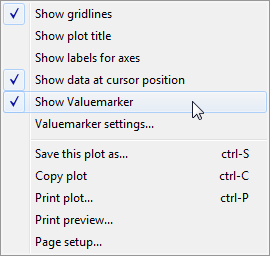
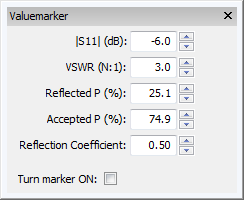
The value can be set by opening Valumarker settings... from the menu above or from View Menu. Here it is possible to enter the value in various forms: LogMag, VSWR, Reflected Power, Accepted Power or Reflection Coefficient. Notice that when a value is entered in any of the fields the other fields will automatically be updated. This makes this window a useful way to convert between the different formats.
At the bottom of this page is a full screen-shot with the Valuemarker set to VSWR = 3.0 : 1.
The value marker settings, both the value and if it is turned on or off, are persistent and the last values will be restored when BetaMatch is started.
Note
Automatic zoom to VSWR-circle
In the Smith Chart it is possible to have the plot to always zoom to the area set by the Valuemarker. See description in the section on Smith Chart Plot.
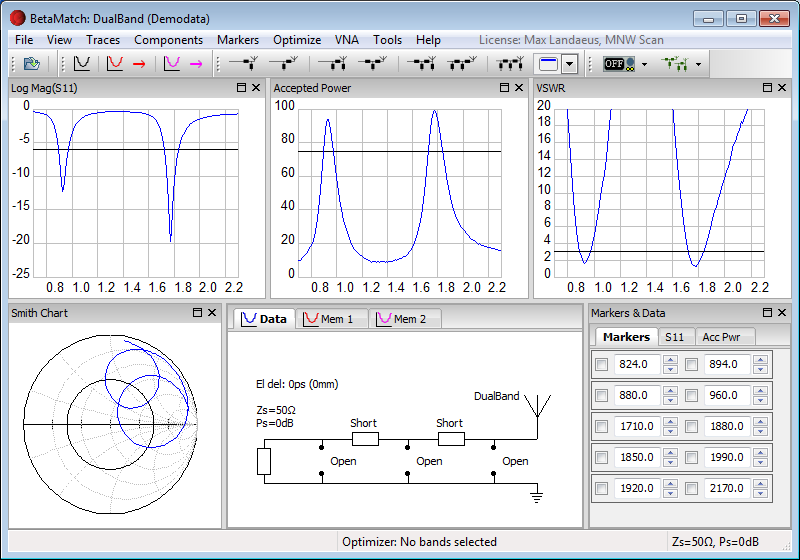
Example of a Valuemarker set to VSWR=3.0:1. Note that the Valuemarker is a constant circle in the Smith Chart and a horizontal line in other plots: